The experimental protocol presented here was run
in May and June 2002 at the Montreal Neurological Institute, one of the four member
institutions of the International Consortium for Brain Mapping. The other members
are the University of California at Los Angeles, the University of Texas at San
Antonio, and Juelich/Heinrich Heine University in Germany.
This consortium
was formed in 1993. Its primary goal is to develop a probabilistic atlas of the
human brain (by definition, any brain atlas can only be probabilistic, because
of the great morphological and functional variations among different individuals’
brains).
This atlas will cover both the brain’s structural anatomy
(the probability that a given structure will occur at a given site in the brain)
and its functional anatomy (the probability that neuronal activity will increase
at a given site in the brain while the individual is performing a given task).
The protocol that will now be described deals with the brain’s functional
anatomy.
Fifty healthy subjects aged 20 to 40 participated in this protocol
in Montreal. The same number of subjects were tested using the same protocol at
the three other universities in the consortium, so that the results could be pooled.
At all of the universities, each subject performed a battery of five common reference
tasks while undergoing a functional
magnetic resonance imaging (fMRI) brain scan, then repeated the battery
while undergoing a positron
emission tomography (PET) brain scan.
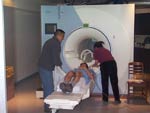
This first set of photos
shows a few steps in the part of the protocol where fMRI was used.
| | | |
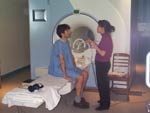
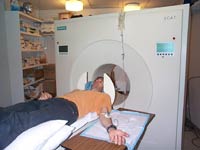
| The subject receives instructions and is placed in the fMRI scanner. | |||
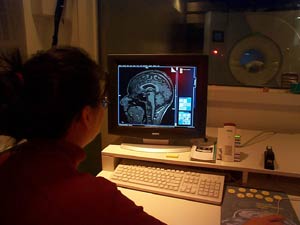 | 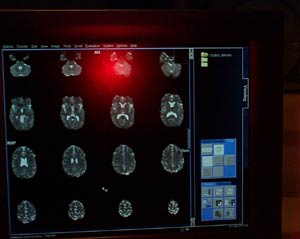 |
| After a few minutes, the computer produces structural MRI images of sagittal sections (left) and axial sections (right) of the subject’s brain. | |
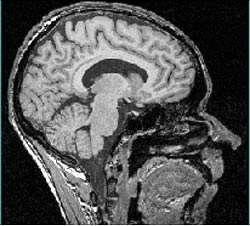
A sagittal section
showing the inside of the subject’s left cerebral hemisphere.
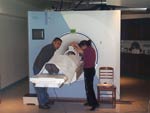
Now here are some photos showing a few steps in the part of the protocol where PET was used.
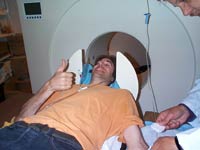 | 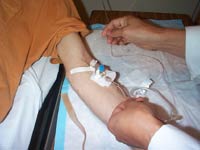 |  |
| A catheter is inserted in the subject’s arm and is used to inject a radioactive solution at regular intervals during the scan. | ||
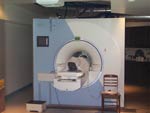
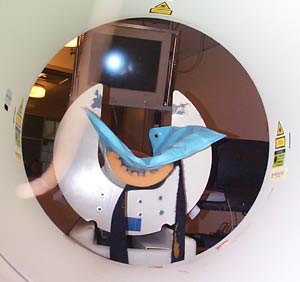 | 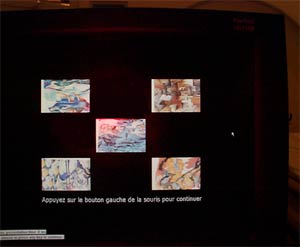 |
| Rear view of the scanner, with the monitor that displays the images associated with each task that the subject performs. The images here are abstract designs used in the task that exercises the subject’s working memory. | |
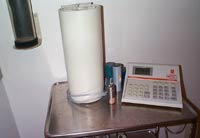
The aqueous radioactive
solution used in this protocol has a short half-life (2 minutes). It is produced
in this room adjacent to the PET scan room, then taken into that room, where its
radioactivity level is checked before it is injected into the subject.
Here is a brief description of the five tasks that each of the subjects performed under fMRI and PET:
Each of these tasks also
included a control task that enabled the computer to determine which areas of
the brain were the most active during each specific task.
The following
picture summarizes the results obtained for these five tasks. The two white circles
in the centre image indicate sites of potential interest for transcranial
magnetic stimulation (TMS) combined with a PET scan.
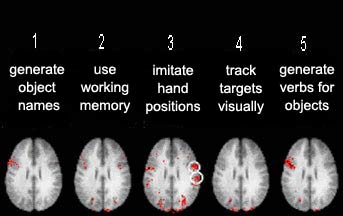
Source: International Consortium for Brain Mapping
and Dr. Roger Woods, UCLA.
This next picture compares the results
for five different subjects for two of the five tasks: imitating a hand position
and generating a verb. Note the great variation from one subject to the next.
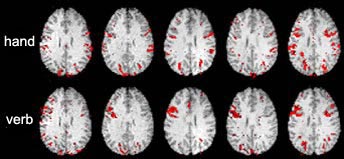
Source: International Consortium for Brain Mapping
and Dr. Roger Woods, UCLA.
Lastly, here are a few images of the brain of the subject shown in the preceding pictures, while he performed some of the five tasks.
Axial section scanned
by fMRI while the subject generated the names of objects after hearing descriptions
of them. The primary
activity is in the left hemisphere, in the areas associated with
understanding and generating language.
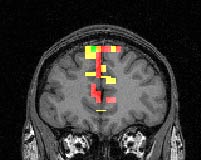
Coronal section scanned
by fMRI while the subject used working memory to track abstract designs, The primary
activity is in the prefrontal cortex.
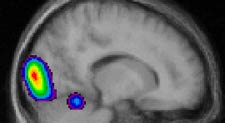
Sagittal section scanned
by PET while the subject imitated positions with his right hand. The primary activity
occurs in the visual cortex, and the secondary activity in the cerebellum, which
is responsible for motor co-ordination.
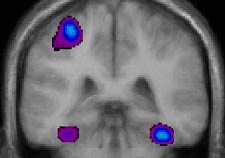
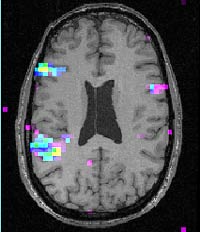
Coronal section
scanned by PET while the subject imitated positions with his right hand. The primary
activity occurs in the motor cortex of the left hemisphere and
the secondary activity in the two ventral visual cortexes.
![]()
| Close this window |